

What are Dot Plots?
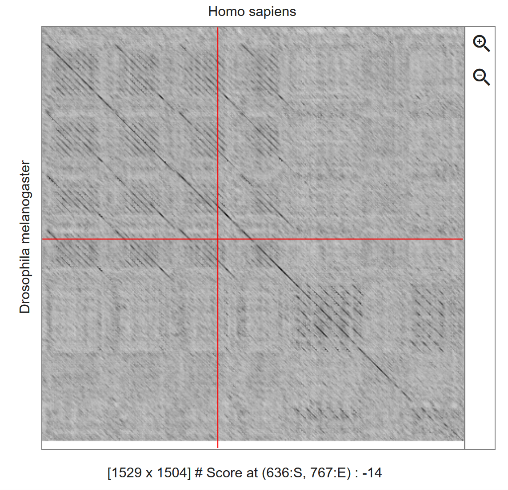
Dot plots are a simple visual tool used in bioinformatics to compare two genetic or protein sequences (DNA, RNA, or proteins). They work using a grid where one sequence is placed horizontally and the other vertically, with a dot marked whenever the letters match. When there is a long stretch of similarities, these dots align and form a visible diagonal line.
What are they used for?
- Finding similarities: They allow you to quickly identify parts of the genetic code that are identical or very similar between two organisms or two samples.
- Detecting structural mutations: Through the shape of the lines in the plot, it is possible to see if large changes have occurred, such as deleted segments (deletions), duplicated segments (repeats), or flipped segments (inversions).
- Rapid screening: They serve as an initial visual "X-ray" before using more complex and time-consuming computational tools.
Utility in Medicine
- Diagnosis of genetic diseases: They help identify chromosomal mutations in patients, such as small DNA losses or repeats associated with rare syndromes or a predisposition to certain diseases.
- Cancer research: In tumor cells, DNA frequently undergoes major rearrangements and breaks. Dot plots make it easier to visualize these abnormalities when comparing a patient's healthy DNA with tumor DNA.
- Surveillance of viruses and bacteria: They allow comparing the genome of a virus collected from a patient with a reference version, helping to quickly detect new variants or mutations that confer resistance to antibiotics and antivirals.
- Vaccine and drug development: By comparing proteins from different strains of an infectious agent, researchers identify regions that do not mutate (continuous lines), creating drugs targeted at these stable areas.
What is the Workflow?
- Sequence collection: Data for the two sequences to be compared (for example, the healthy reference gene and the sequenced gene from a patient) is obtained in plain text format (such as FASTA format).
- Parameter definition (Filtering): Since DNA only has 4 letters (A, T, C, G), many random matches occur that generate "noise" (scattered dots). To clean up the plot, a reading window is defined (e.g., comparing blocks of 10 consecutive letters) along with a stringency threshold (e.g., only marking a dot if at least 8 of those 10 letters match).
- Matrix generation: The software cross-references the two sequences row by row and column by column, plotting dots in the positions that meet the defined criteria.
- Visual interpretation: The specialist analyzes the pattern formed by the diagonals. A continuous straight line indicates normality, while breaks, shifts, or parallel lines reveal the presence and exact type of mutation.
Adicionar comentário
Comentários